Anketler ve formlar için en iyi uygulamaları öğrenin
SurveyMonkey ekibinin kaynakları ve makaleleri ile anketlerinizden ve formlarınızdan en iyi şekilde yararlanın.


Kaynaklarımızı keşfedin
Öne çıkan makaleler

Net Promoter® Score'u doğru bir şekilde hesaplayın ve puanınızı iyileştirmek için ipuçlarını keşfedin.

Çalışanlarınız mutlu mu? Öğrenmek için etkili anket sorularını nasıl oluşturacağınızı öğrenin.

Ekibiniz için en uygun toplantı zamanlarını belirlemenin kolay yolunu keşfedin.

Anketiniz için kaç yanıtlayana ihtiyacınız var? En iyi sonuca ulaşmak için örnek boyutu hesaplayıcımızı kullanın.
Doğru anket uygulamaları

En iyi anket uygulamaları ve tasarım yönergeleri
Bir profesyonel gibi anket tasarlayın, yanıt toplayın ve verilerinizi analiz edin.
İşle ilgili daha iyi kararlar vermek için anket oluşturmayı, yanıt toplamayı ve verileri analiz etmeyi öğrenin.
Fikirleri ölçmek ve gerçek zamanlı verilere dayanarak karar vermek için anında geri bildirim alın.
En yaygın anket ön yargısı türlerini ve araştırmanızda bunlardan nasıl kaçınacağınızı öğrenin.
Fikirleri, algıları ve davranışları ölçmenin en güvenilir yollarından birini ve bu yöntemi bir sonraki anketinizde nasıl kullanabileceğinizi öğrenin.
Sık kullanılan anket sorularını keşfedin ve en iyi sonuçları verecek şekilde etkili anketleri nasıl oluşturacağınızı öğrenin.
Müşteri geri bildirimleri

Başarılı müşteri geri bildirimi programları nasıl oluşturulur?
Ürünleri, hizmetleri ve müşteri ilişkilerini geliştirmek için geri bildirim toplamaya ve kullanmaya ilişkin en iyi uygulamaları öğrenin.
Sorunları azaltıp sadakati artırmak için Müşteri Çaba Puanından yararlanabilirsiniz.
NPS'i nasıl hesaplayacağınızı, müşteri deneyimini ve memnuniyetini ölçmek için nasıl anket oluşturacağınızı öğrenin.
NPS'in avantajları ile sınırlarını, müşteri sadakatini ölçmek ve işletme büyümesini tahmin etmek için neden yaygın olarak kullanıldığını keşfedin.
Uygulayabileceğiniz görüşler almak için daha iyi müşteri memnuniyeti anketleri yazmayı öğrenin.
Hizmet kalitesinin beş boyutunu ölçerek müşterilerinizi memnun etmenin ve deneyimlerini geliştirmenin yeni yollarını bulabilirsiniz.
Pazar araştırması

Pazar araştırması: Nedir, neden önemlidir ve nasıl kullanılır?
Müşteriler, duygular ve daha geniş pazarlar hakkında uygulanabilir görüşler elde etmenizi sağlayan, veriye öncelik veren bu strateji hakkında bilgi alın.
İlgi çekici pazar araştırması anketleri oluşturmak için neler yapmanız gerektiğini öğrenin.
İkincil araştırmanın birincil araştırmaya göre farkını ve işletmenizde ikincil araştırmayı neden kullanmanız gerektiğini öğrenin.
Ürün ve hizmetleriniz hakkında daha iyi karar vermek için ihtiyacınız olan bilgileri edinin.
Sonuçlarınız istatistiksel anlama sahip mi? Anket sonuçlarınızın güvenilirliğini sağlamak için bu hesaplayıcıyı kullanın.
Çalışan geri bildirimi

Çalışan geri bildirimi: ipuçları, örnekler ve şablonlar
Doğru sorular sormayı, sağlam bir çalışan geri bildirim programı oluşturmayı ve sonuçları kullanarak çalışanlarınızı elde tutma oranını artırmayı öğrenin.
İşe alım sürecini iyileştirmenize ve en iyi adayları bulmanıza katkıda bulunacak soruları öğrenin.
Bağlılığı artırmak, iş yerindeki sorunları tespit etmek ve kuruluş kültürünü geliştirmek için çalışan anketlerini kullanmanın faydalarını keşfedin.
Eğitim programlarının verimliliğini değerlendirmek ve iyileştirmeye açık alanları belirlemek için çalışanlarınızı eğitim anketleri ile destekleyin.
Net iletişim, takdir ve kapsayıcılık yoluyla sağlıklı bir çalışma kültürünü teşvik etme stratejilerini öğrenin.
Kuruluşunuzun daha kapsayıcı bir kültür oluşturmasına yardımcı olacak anket şablonlarından ve uzman rehberliğinden yararlanın.
Formlar

Çevrimiçi formlar oluşturma
SurveyMonkey ile çevrimiçi formları kolayca oluşturun ve yanıtları hemen toplamaya başlayın.
Yapı, soru türleri ve kullanıcı deneyimine yönelik en iyi uygulamalar da dahil olmak üzere, etkili çevrimiçi formlar tasarlama konusunda rehberlik alın.
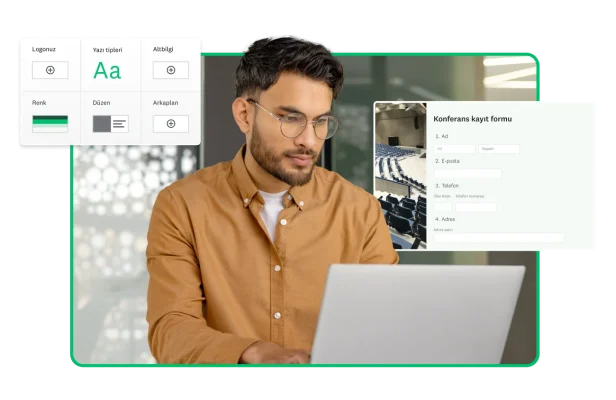
Özelleştirmesi ve doldurması kolay çevrimiçi kayıt formları oluşturun. Çeşitli şablonlar arasından ihtiyaçlarınıza uygun olanı seçin.
İşletmenizi, ürününüzü veya markanızı geliştirmek için doğrudan müşterilerden ve diğer kişilerden geri bildirim toplayın.
LCV formları oluşturmak için ipuçları alın ve etkinlik katılımını verimli bir şekilde yönetmek için davetlilerin yanıtlarını nasıl toplayıp takip edeceğinizi öğrenin.
Yerleştirilebilir formlarla yanıt oranlarını artırın, iletişim bilgilerini toplayın, kayıtları ve başvuruları kolaylaştırın.
Araştırma ve analiz

Anket verilerini analiz etme: yöntemler ve örnekler
Anket verilerinizi nasıl etkili bir şekilde analiz edeceğinizi ve daha iyi anketleri nasıl oluşturacağınızı öğrenin.
Doğru bilgi ve araçlarla, uzman olmanıza gerek kalmadan anket verilerinizi analiz etmek için istatistiksel yöntemleri kullanabilirsiniz.
Keşif araştırmasını derinlemesine inceleyin ve araştırmalarınıza uygulamanın dört yolunu öğrenin.
Nedensel araştırma: Bağlantıları bulmak işle ilgili daha iyi kararlar alınmasını nasıl sağlayabilir?
Hipotezleri test edip sonuçları inceleyerek neden-sonuç ilişkilerini anlayın ve bilinçli kararlar verin.
Şirketinizin anketlerini güçlendirmeye yardımcı olmak için nicel araştırma kullanımı ile ilgili ipuçlarımıza göz atın.
Hata payını nasıl bulacağınızı öğrenin ve hemen ölçmek için çevrimiçi hesaplayıcımızı kullanın.
Ürün geliştirme

Neredeyse gerçek zamanlı geri bildirimler almak daha iyi ürünleri daha hızlı geliştirmenize nasıl yardımcı olur?
Müşteri geri bildirimi toplamak, ihtiyaçları belirlemek ve ürün geliştirmelerine rehberlik etmek için ürün geliştirme sürecinde anketleri nasıl kullanacağınızı öğrenin.
Fikir elemenin, araştırma ve analizle desteklenen başarılı ürünler ortaya çıkarmanıza nasıl yardımcı olacağını öğrenin.
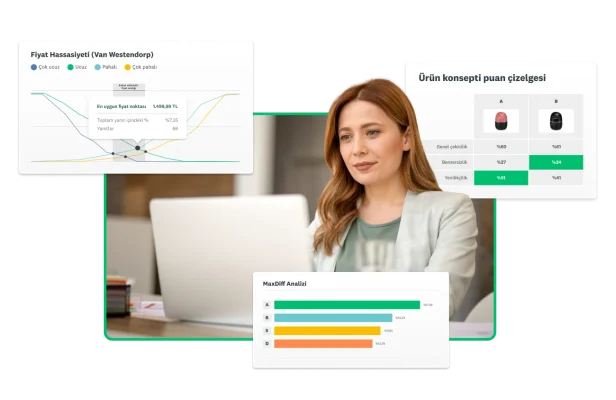
Müşterilerin ödeme istekliliğini değerlendirerek fiyatlandırma stratejilerine ve pazar talebine ilişkin görüşler sağlayın.
Ürün ve müşteri memnuniyetini geliştirmek için lansman öncesinde ve sonrasında görüş alın.
Ürün konseptlerinizin ve fikirlerinizin bir saatten kısa sürede güvenilir bir hedef kitle tarafından onaylanmasını sağlayın.
Yeni reklam kampanyanızı, ürün lansmanınızı ve daha fazlasını geliştirmek için konsept testi anketini planlamayı, tasarlamayı, göndermeyi ve analiz etmeyi öğrenin.
Etkinlik yönetimi

Geri bildirim yönetimi: Etkinlik öncesi ve sonrası anketleri
Sonraki etkinliğinizin baştan sona başarılı olması için ipuçları ve şablonlar alın.
Etkinliğin her aşamasında değerli geri bildirimler toplamak için hangi etkinlik anketi sorularını sormanız gerektiğini öğrenin.
Katılımcıların tercihlerinin ve beklentilerinin alınmasını kolaylaştıran, etkinlik planlama için özel olarak tasarlanan, önceden oluşturulmuş anket şablonları edinin.
Katılımcılarınızdan geri bildirim toplamak için anketlerden yararlanarak daha başarılı etkinlikler düzenleyin.
Sonraki kurumsal etkinliğinizi veya partinizi daha iyi hale getirmek üzere uygulanabilir görüşler toplamak için uzman ipuçları.
Hazırlıklı olun, organize hareket edin ve etkinliklerinizi sorunsuz bir şekilde yürütmek için SurveyMonkey araçlarını kullanın.
Pazarlama

Pazarlama anketleri: örnek sorular, örnekler ve daha fazlası
Sadece birkaç dakikada oluşturacağınız bir pazarlama anketiyle müşteri memnuniyeti, ürünler, fiyatlar, yaratıcı kampanyalar ve daha birçok konuda iyileştirme yapmak için ihtiyaç duyduğunuz verileri alın.
İşle ilgili daha akıllıca stratejik kararlar için pazara dair görüş geliştirin.
Beyin fırtınası sorularından sonuçları analiz etmeye kadar bir reklam testi gerçekleştirmek için en iyi uygulamaları öğrenin ve en iyi seçeneği bulun.
Markanızın performansını takip edin ve zaman içinde nasıl geliştiğini görün.
Özgün araştırmalar yaparak içerik pazarlaması için inandırıcı verileri nasıl elde edeceğinizi öğrenin.
Sektör çalışanlarının pazarlamada yapay zekayı nasıl kullandığını keşfedin ve SurveyMonkey'in yapay zeka kullanımına ilişkin araştırma istatistiklerine göz atın.
Eğitim

Okullar, öğretmenler ve öğrenciler için eğitim anketleri
ABD Eğitim Bakanlığı ve Harvard Graduate School of Education ile birlikte çalışarak eğitim alanında iyileştirmeler sağlayan anket şablonları tasarladık.
Okulunuzun veya üniversitenizin ne durumda olduğunu öğrenmek için öğrencilere, öğretmenlere ve velilere eğitim anketleri gönderin.
Öğrencilerin ihtiyaçlarını, tercihlerini ve karşılaştıkları zorlukları anlayarak daha destekleyici bir eğitim ortamı oluşturabilirsiniz.
Öğrenci anket soruları ile öğretme yönteminizi geliştirin. Daha iyi eğitim için dersler, etkinlikler ve daha fazlası ile ilgili dürüst geri bildirimler alın.
Veli katılımını artırmak için SurveyMonkey ve Harvard Graduate School of Education K-12 anket şablonunu kullanın.
Anketlerden elde edilen veriler ve görüşlerle bilimsel araştırmalarınıza derinlik katın.
Sağlık

Sağlık anketleri: sorular ve şablonlar
Hastalardan geri bildirim toplamak, hizmet kalitesini artırmak ve tıbbi tesislerde karar alma sürecini desteklemek için sağlık anketlerini kullanın.
Hasta memnuniyeti anketlerini kullanarak sağlık hizmeti deneyimlerini değerlendirin ve hasta bakımında iyileştirmeler yapın.
Sağlık kuruluşunuzdaki hasta güvenliği kültürünü değerlendirmek ve iyileştirmek için bu anket şablonunu kullanın.
Klinik çalışmalar, hasta sonuçları ve sağlık alanındaki gelişmelerle ilgili önemli verileri toplamak üzere anketleri nasıl kullanacağınızı öğrenin.
SurveyMonkey'in HIPAA uyum şartları olan müşterileri nasıl desteklediğini öğrenin.
Örnek değerlendirme soruları ve sağlık anketi örnekleri edinin ve bir uzman gibi sağlık anketi sorusu yazmayı öğrenin.
Testler

Katılım ve değerlendirme için soru tasarımı, biçimlendirme ve testleri kullanma hakkındaki bu ipuçlarıyla etkili testler oluşturun.
Kâr amacı gütmeyen kuruluşlar

Çevrimiçi anketler yoluyla bağışçılarınızdan, gönüllülerinizden ve bağış toplama etkinliklerinizden değerli geri bildirimler alın.
Net Promoter, Net Promoter Score ve NPS; Satmetrix Systems, Inc., Bain & Company, Inc. ve Fred Reichheld'e ait tescilli ticari markalardır.